


What makes a business boom? Business intelligence does! We live in a data-rich world, where information of every business movement (no matter how complex) can be stored as data. Thus data plays a foundational role in making a small business or startup scalable. And the tool that makes it happen—is business intelligence software.
What is business intelligence software? Business intelligence software brings together the strategies and technologies of data science to analyze data for a business. When you analyze your data with powerful BI software, it reveals many insightful analyses that can be shaped into productive actions.
The only issue is, they are expensive! The top business intelligence software like Tableau and Sisense can be well beyond the budget of a small to medium business. Even an average BI software can end up costing you $3000 a year.
Thankfully there are a few Good Samaritans in the BI industry who have developed free Business Intelligence software. In this blog, we will cover the 7 best free BI software.
Note: Most of the free business intelligence Software also provides a paid upgrade.
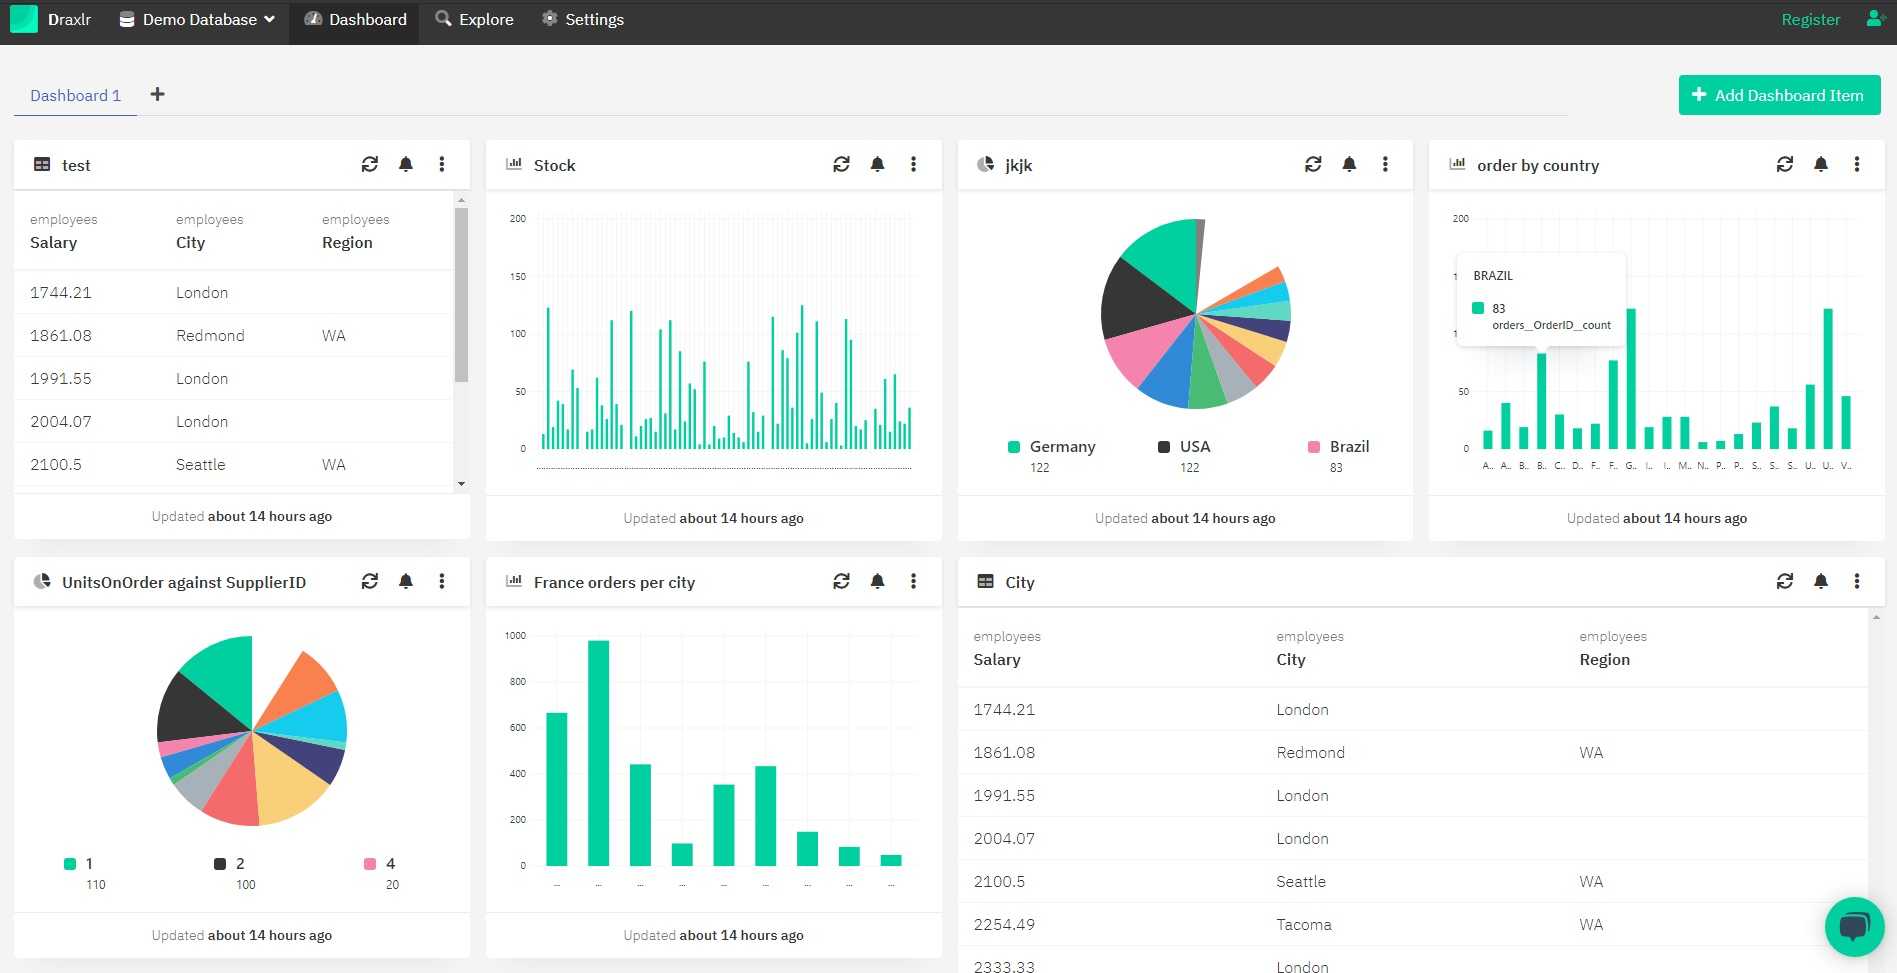
1. Draxlr
Motto: Simplifying Business analytics and monitoring
Paid edition price: Pro $29/month | Premium $149/month (Final price with all the features).
Note: Easy to get business insights, monitor data, and share dashboards.
Many popular BI platforms provide a free trial, but eventually need you to pay; not Draxlr! Draxlr is free for as long as you want it to be free, making it one of the best choices for small and medium businesses. You can make paid upgrades to increase the strength of different features.
Draxlr is a powerful, yet affordable BI platform for all professionals. The interface is uniquely simple, making it accessible by both IT and Non-IT professionals.
Draxlr features address a major data question—How to get actionable insights from data? Actionable insights don't solely rely on powerful visualizations. Insights are often inspired by appropriate data change monitoring, organized visualization, and data analysis sharing—Draxlr, surprisingly takes into account all three areas.
Draxlr helps you visualize your data as charts and graphs for a meaningful representation. You can have multiple dashboards to track data for different projects (or departments,) separately—this improves the organization of your data visualization.
The visuals on Draxlr dashboards can be downloaded as an image file, the dashboards themselves can be embedded into your company websites/applications, and the dashboards can even collaborate with other platforms by reporting API.
Draxlr dashboards are live dashboards—meaning you can set up the dashboards for automatic periodic data refresh. And the best part is, you can also set up each visual on the dashboard to send you a Slack and Gmail alert for every data change.
Draxlr supports PostgreSQL and MySQL databases for the time being and also integrates with the Heroku platform. This BI platform uses five comprehensive tools of data analysis to build complex data queries. You can use these tools to filter your data, combine data from multiple tables, sort your data, summarize your data, and group your data.
The BI tools in Draxlr make data analysis easy by automatically identifying the right analysis choices. For example filtering is made easy as Draxlr automatically identifies the applicable filter operations depending on the type of data. Similarly while combining multiple tables, Draxlr automatically identifies the related tables, and within them the related attributes. Draxlr automates most of the data science technicalities, while you concentrate solely on the data.
Many frontline BI software face criticism for their crowded interface and steep learning curve. Draxlr does a pretty good job in these areas. The interface is very neatly organized and the tools are easy to handle. You don’t have to be a specialized data analyst to use Draxlr, it can be used by any professionals. Further, Draxlr also provides free tech support web conferences to assist with the software.
Even the paid versions of Draxlr are a win-win situation as they come incredibly cheap, and what beats the price is their benefits. The premium version of Draxlr gives you unlimited user invites—whereas, for most other premium tools you need to pay on a per-user invite basis.
2. Visualize Free
Motto: Visualize Free is Data preparation-visualization.
Paid edition price: Known as Inetsoft Style intelligence. Plans starting at $2,800/year.
Note: Focuses primarily on free data visualization.
The title says it all! Visualize Free is a straightforward online business intelligence platform. You upload your data, analyze and visualize it, and share it with people—for free. Visualize Free focuses to make data analysis accessible to all, especially to people who are new to analytics and are still in the learning process.
You will not be able to connect to cloud databases and data sources, but you can upload text and excel files for analysis. The platform provides many samples of analytic dashboards and interactive visuals to explore. You can explore the samples to understand how the platform works, before beginning with your own creation. The best part is you won't need to register to explore.
Visualize Free comes with a simple pint and click interface, that is extremely user-friendly when creating interactive visuals and discovering new insights. You can share the URL of your analysis with team members and analyze it collaboratively. Unlike many free and public BI platforms, your data on Visualize Free remains private. The analytics will only be available to you and the people with the shareable link.
3. Metabase
Motto: Help everyone learn from data. No SQL required
Paid edition price: Starter-$85+ | Growth-$749+ | Enterprise- $15k+/year
Note: Metabase is a powerful open source real-time BI tool.
If you are looking for an open-source business intelligence software, try Metabase! Its free open source edition is quite popular among analysts. Metabase can be installed on any system that supports Java 8 or higher. While the free version lacks some premium features, it covers all the essentials. If you’re considering other options, explore these Metabase alternatives for a detailed comparison.
Metabase is well known for its interactive data visualization. The visual cards also hold a “Customize Click Behaviour” button that allows you to customize how a visual card interacts (upon clicking) and how you can further explore the data it holds. Depending on the data and analysis type, you can edit what happens when someone clicks a particular data element on the card.
Metabase can connect with multiple databases, query data without requiring you to write SQL codes, and send data change alerts (but only when data reaches a certain threshold.)
4. PopSQL
Motto: Collaborative SQL editor for your team.
Paid edition price: Premium-$199/month | Business-$499/month.
Note: PopSQL might not be the easiest open source business intelligence tool, but to a core analyst it can be a wonder.
PopSQL is more of a SQL client with analytics and dashboard-building features. This straightaway takes us to its biggest drawback—you need to write SQL queries for analysis. Making PopSQL relevant mostly to core analysts and IT professionals. However, it’s completely free and thus worth a mention. PopSQL also provides a free trial for its “Premium” and “Business” versions.
The objective of PopSQL is very simple—you write a query, visualize it, and share it! In PopSQL you can write multiple queries at once, which is convenient and time-saving. You can also organize your codes and save them in folders for future use. PopSQL can highlight incorrect codes to speed up troubleshooting.
Finally, PopSQL is widely loved for the learning opportunities it provides (even in the free version.) PopSQL is recommended to professionals with a coding background, but the extensive tutorials on PostgreSQL, Redshift, MySQL, SQL Server, BigQuery, and Snowflake can be a help to those with a non-coding background.
5. Google Data Studio
Motto: N/A
Paid edition price: Free
Note: Has the strengths of google services. Its ability to connect with a variety of data sources is admirable.
Google Data Studio is the only free Business intelligence web application by Google. Although it lacks a few premium features found in paid Google services like Google Analytics and Looker.
Google Data Studio has two main sections—reports and explorer—that deal with all business intelligence tasks. The reports section acts as a query builder cum dashboard, whereas the explorer section offers you options to explore your data, visualize it and discover meaningful insights. You can insert visualizations like tables, graphs, charts, timelines, and maps. You can both download your reports as pdf and share them with others like sharing Google docs and Sheets.
The most prominent advantage of using Google Data Studio is the diverse range of data sources it can connect with, including, Google Sheets, Google Analytics, SQL databases, BigQuery and so on.
6. Power BI Desktop
Motto: Find Clarity when you need it most.
Paid edition price: Power BI Pro- $9.99 / User-month (but limited features) | Power BI Premium-Starts at $4,995 / month.
Note: Power BI Desktop is good for learning and exploring, but scaling your business is not really its strong suit.
Are you looking for Power BI alternatives? Do you love the analytics and visualizations of Power Bi, but find it too expensive? Well, problem solved! The industry leader Power BI has a free desktop edition.
The data visualization options of Power BI Desktop are also quite remarkable, including maps, gauges, funnels, hierarchy trees, charts, graphs, and so on. Power BI Desktop runs on-premise and thus misses out on collaboration, sharing, embedding, and API features commonly found on cloud business intelligence services.
Power BI Desktop has an advanced query editor and data modeling features. Microsoft Power BI Desktop can help you build incredibly complex queries with its Data Analysis Expressions library. Currently, the DAX library has around 200 functions that the Power BI uses to perform analytics on your data. However, with no cloud computing services, scaling your business with Power BI desktop is too tedious.
7. Tableau Public
Motto: Your Data has a story, share it with the World
Paid edition price: Viewer-Starts at $12 | Explorer-Starts at $35 | Creator-Starts at $70
Note: Makes your visualizations public. Tableau Public is light and casual BI tool and falls short on many business scaling features. This Free edition is more of a sneak peek at its premium paid edition.
Tableau Public is the free version of yet another BI industry leader, Tableau. Tableau Public also has an installable desktop version; both the web software and desktop software sync perfectly. Both Tableau Public and Tableau Public Desktop can create amazing visualizations from your data. Tableau Public allows you to clean and arrange your data, build powerful calculations with the data to establish complex relations, and review statistical summaries.
However, Tableau Public does have a few drawbacks. Firstly, once you publish your visualizations they become public. Secondly, your data storage is limited to 10 GB (Although this issue can be fixed by installing the desktop edition.) Thirdly, Tableau Public can only read from Excel and text files. Fourthly, automatic data refreshing is not available. And fifthly, Tableau Public doesn't excel in sharing your data and collaborating with other cloud platforms.
What is the right BI Software for your business?

To be honest, Business Intelligence is a premium service that can bring significant difference to your revenue. And as such, top free business intelligence software is highly revered. All the software mentioned in the above list is very promising. They are all good at storing the data, cleaning and arranging the data, blending and modeling the data, processing the data, building advanced queries, visualizing the data, and managing a dashboard.
Now, this makes the task of choosing the right BI tool all the more conflicting. So a good way to decide is to rely on user-friendliness. Select an affordable BI software for your small business or startup that doesn’t have an overly technical interface and needs a lot of training. Since all the software mentioned above gets the job done, stick with the one that’s least complicated. This will let you reflect on the analysis, rather than being caught up in technical setbacks.
- Anubhav


